邓普顿投资备忘录(1953)之投资平衡实例
12 Jun 2019Content
上一篇邓普顿在备忘录中讲述判断股价正常水平的原则, 本篇文章备份下邓普顿基金公司(Templeton, Dobbrow & Vance Inc)实操图例说明以及邓普顿的一些评论.
图例说明1
One of Templeton’s colleagues at Templeton, Dobbrow & Vance, Brevoort Stout, added some further explanatory detail of the practical issues involved in running such a program for clients. The table at the end of his memo (reproduced here as Table 2.1) illustrates how simply a client’s stock market exposure would be adjusted for different levels of the stock market, as represented by the Dow Jones Industrial Average.
| — | Dow Jones Industrial Average Above 546 | Program Calls for No Stocks |
|---|---|---|
| Sixth Zone Above Normal | 496–546(10%) | 10% Maximum in Stocks |
| Fifth Zone Above Normal | 451–496(10%) | 20% Maximum in Stocks |
| Fourth Zone Above Normal | 410–451(10%) | 30% Maximum in Stocks |
| Third Zone Above Normal | 373–410(10%) | 40% Maximum in Stocks |
| Second Zone Above Normal | 339–373(10%) | 50% Maximum in Stocks |
| First Zone Above Normal | 308–339(10%) | 60% Maximum in Stocks |
| Normal Zone | 293–308 | No Change Necessary |
| First Zone Below Normal | 264–293(10%) | 60% Minimum in Stocks |
| Second Zone Below Normal | 238–264(10%) | 70% Minimum in Stocks |
| Third Zone Below Normal | 214–238(10%) | 80% Minimum in Stocks |
| Fourth Zone Below Normal | 193–214(10%) | 90% Minimum in Stocks |
| — | Below 193 | Fully Invested in Stocks |
根据市场水平, 配置在股市内的资金. 道指水平每增加10%, 股市资金就减少10%, 反之亦然.
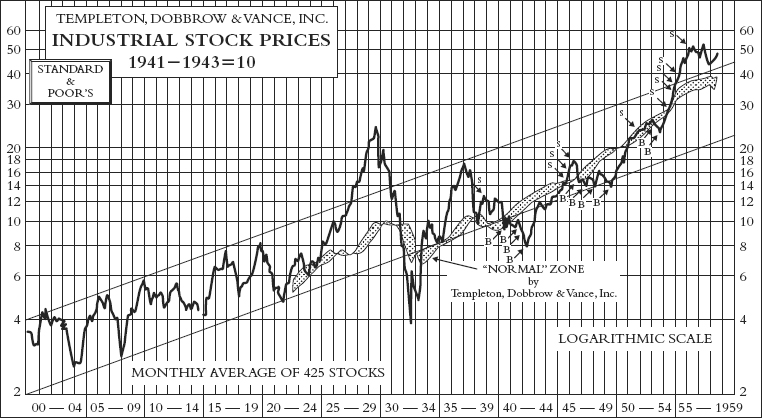
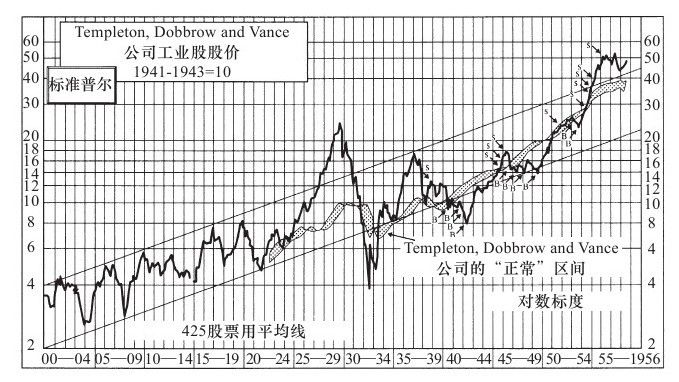
上图中阴影部分是该公司评估的股价正常水平, B: Buy 代表买入, S: Sell 代表卖出. 上图中使用的是标准普尔指数S&P(425只股票), 如何判断市场(指数)的正常水平区域, 可以参考邓普顿投资备忘录(1954)之股价正常水平. 根据市场平均水平, 以及计划, 交易操作. 从上图可以看出, 1920 - 1930年S&P呈现上升形态. 如果根据其正常水平区间, 会慢慢减少在股市中的资金比例, 会错过最高水平的收益. 然而这是事后来看的, 身在当时, 任何人也无法预测短期市场走势, 更别想这在最高点抛出了.
那么这样的操作有没有缺点呢? 能否改进呢? 这种操作能否在个股上使用呢?
邓普顿基金公司的这种操作虽然没法实现收益最大化, 可能因为过早卖出而损失后期高点收益, 但这也是保证收益的最好方法, 因为在上升第六阶段,还有10%的资金留在股市, 最后可能还能享受高点收益. 这个方法在指数投资上或许可以实践下.
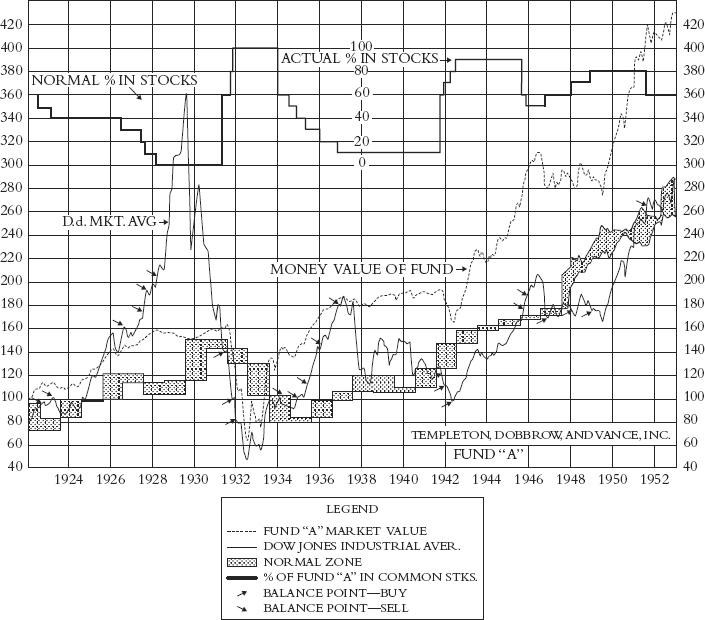
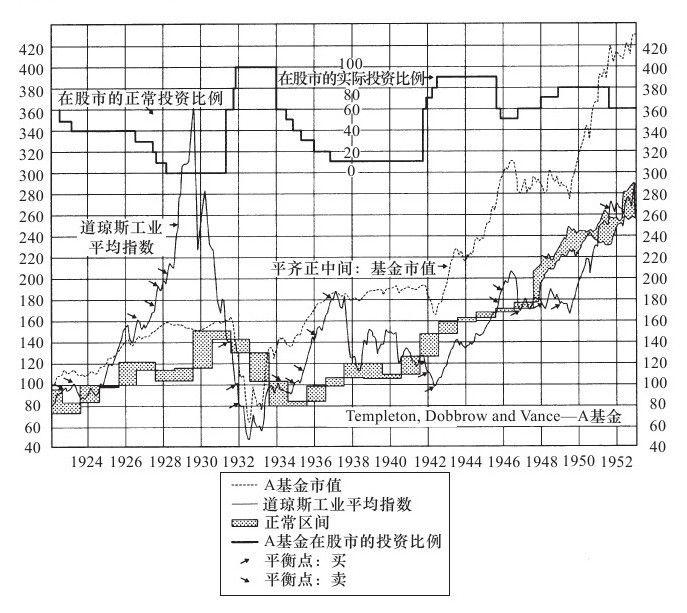
下面是邓普顿基金公司(Templeton,Dobbrow and Vance) FUND A 基金的资金与调仓图示.
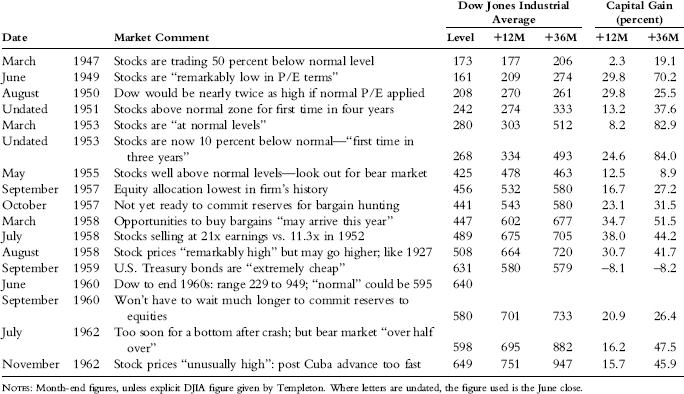
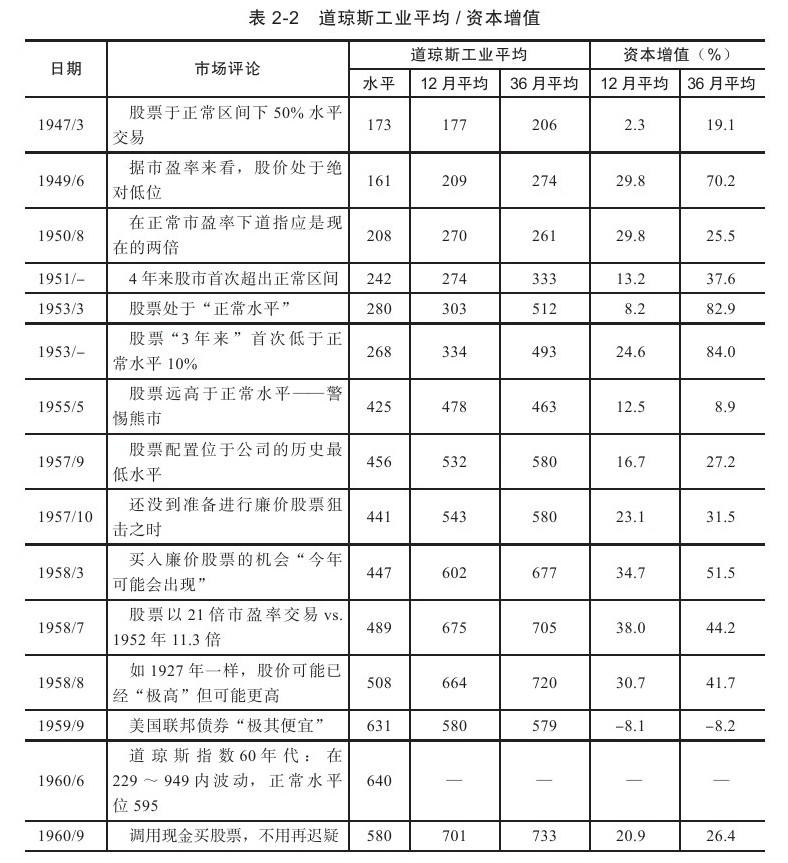
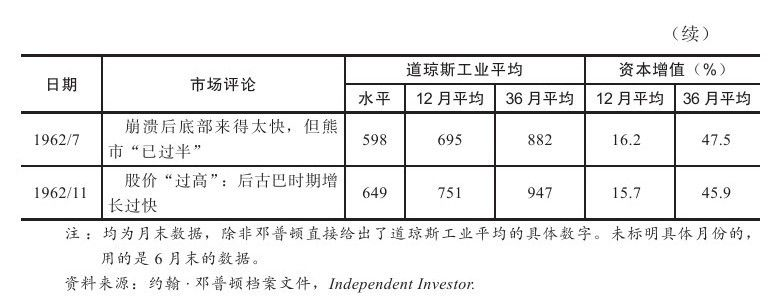
下表2是邓普顿的评论表, 对于道指水平的评论.
根据邓普顿的评述, 对于你判断市场水平, 以及何时进场, 思考市场, 是否有所帮助呢?
ChangeLog
@Jeremy Anifacc
2019-06-12
人生苦短, 为欢几何.


